The time has come for a new release of our PowerVR Graphics SDK. We’re very excited about the new features we’ve included in PowerVR Graphics SDK v3.2, especially since we know how eagerly anticipated many of them are.
Since our previous release, we’ve focused a lot of our efforts on our cross-platform profiling and debugging utilities based on feedback we’ve received from our developer ecosystem. Major developments in the PowerVR Graphics SDK v3.2 include: multithread, multi-window playback and recording capabilities for PVRTrace; OpenGL ES driver timing data for PVRTune; the ability for applications to submit their own timing blocks to PVRScope; and extensive debug output when OpenGL ES errors occur for PVRVFrame.
On Android and Linux, we’ve streamlined our device side tools into a single unified package – PVRHub. PVRHub simplifies device configuration and presents an intuitive interface for launching our profiling and debugging tools.
The PowerVR Graphics SDK v3.2 includes new, expanded examples for the OpenGL ES 2.0 extensions specific to PowerVR Series5XT GPUs (occlusion queries, floating point textures and many more) and a new 3D texture example using OpenGL ES 2.0 on PowerVR Series6 GPUs.
PVRTrace gets multithreaded, multi-window support
Multithreaded rendering is becoming more popular on multicore CPUs (particularly on Android) and enables developers to issue work to the OpenGL ES driver in parallel. Moreover, it’s possible for an application to have one or more threads that have their own windows.
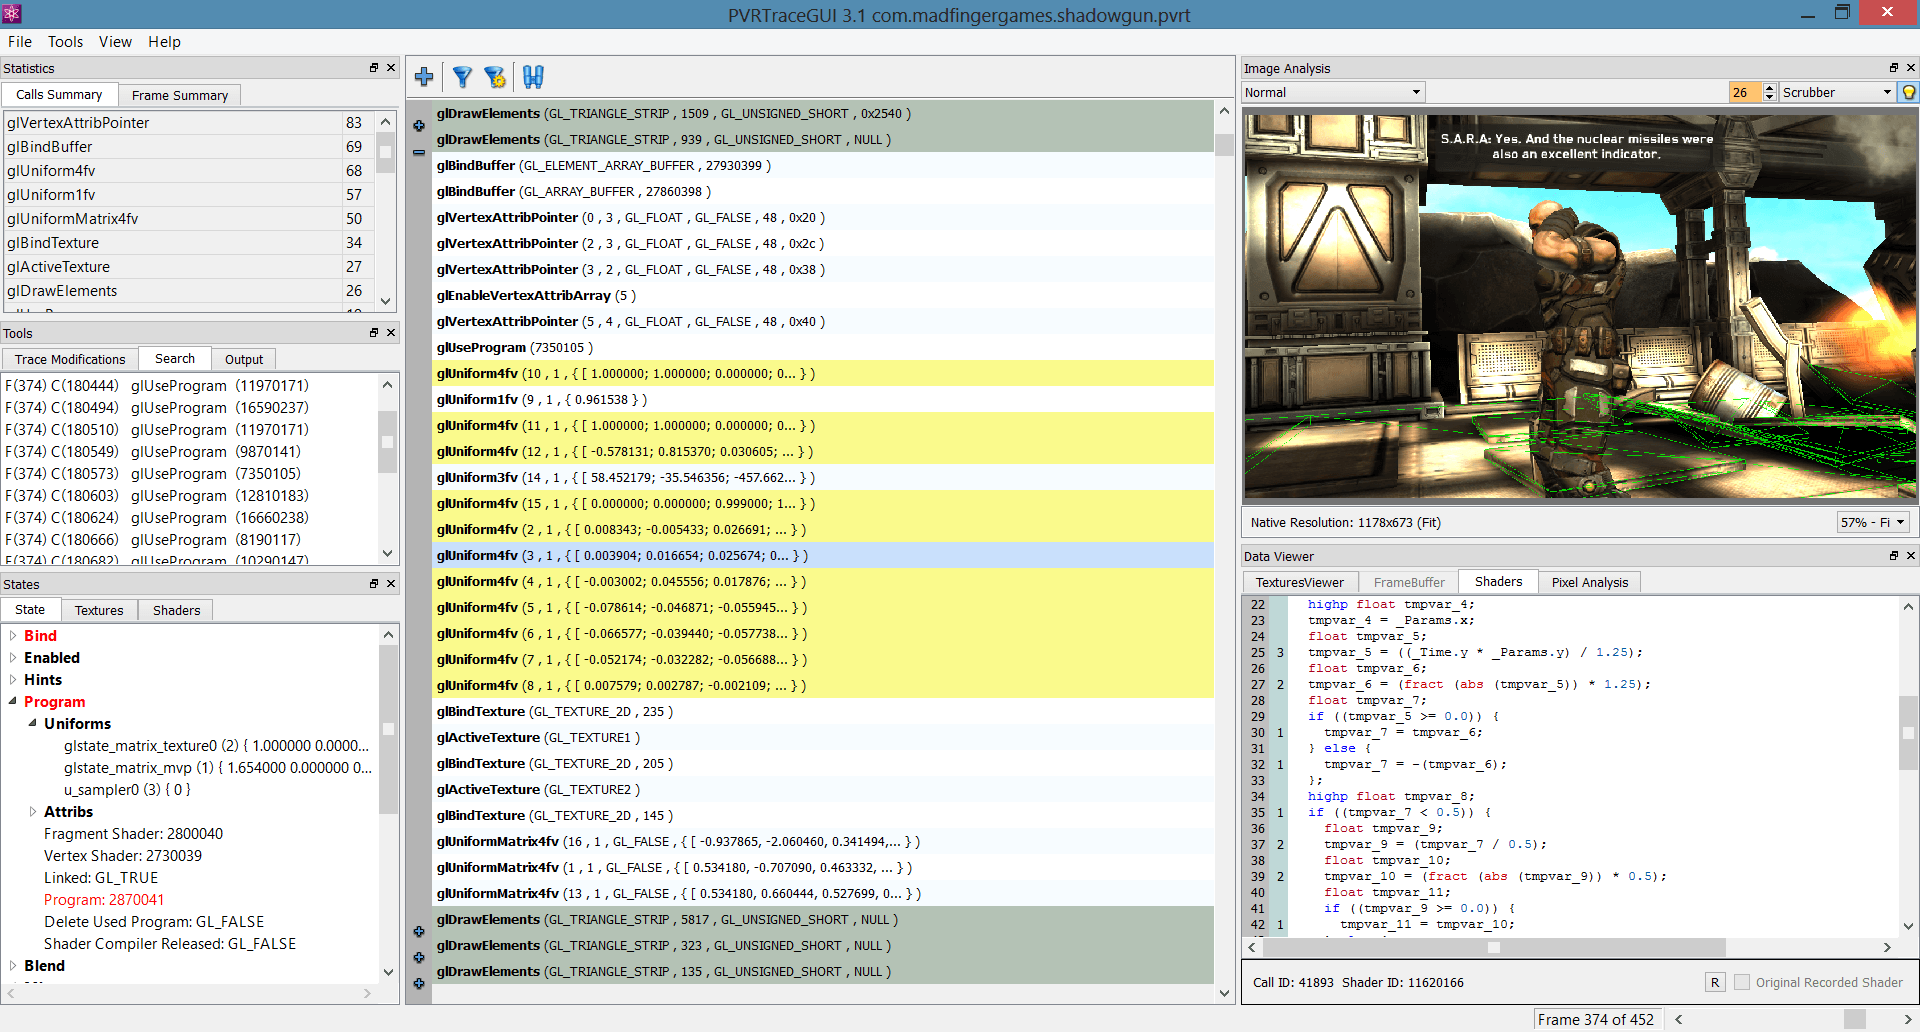
The ability to support multi-thread and multi-window rendering is a very important addition to PVRTrace. Our tool supports all the combinations listed above so developers who want to make full use of multithreading and multi-window techniques can track OpenGL ES and EGL API calls made by their applications without having to sift through source code.
Here are some other new features for PVRTrace:
- API call Static Analysis
Automated analysis of captured OpenGL ES and EGL calls to highlight errors, redundancies and sub-optimal code paths

- Enhanced Shader Analysis
A Vertex ALU Cost analysis mode and extended Frame Summary stats for the total number of vertices processed and average overdraw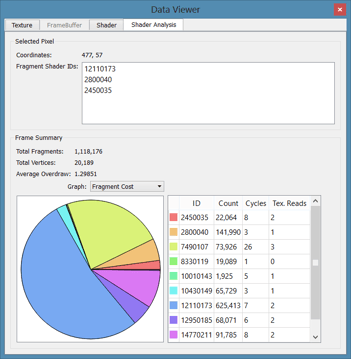
- Statistics Graph
The Statistics Graph visualizes PVRTraceGUI’s Frame and Call stats. It also provides a high-level overview of when rendering threads issued API calls


- OS X recording
In our previous release, it was possible to record OpenGL ES applications on x86 Windows and Linux machines (for example, using our PVRVFrame emulation libraries). In this release, we’ve added OSX recording libraries - Enhanced navigation
The draw call list, multiple highlight colours and per-thread filtering make it even easier to interact with the GUI
PVRTune benefits from enhanced profiling for PowerVR Series6 GPUs
In the PowerVR Graphics SDK v3.2 release, PVRTune dynamically adds a compute row in the graph view for OpenCL timing data. This is very useful if you’re an OpenCL developer because it allows you to see how the compute work is load balanced while other tasks are being processed by the GPU.

To make our graphics driver more transparent, we’ve added timing data for OpenGL ES calls. This allows you to see how much time is being spent in each EGL/GL call of the graphics driver in real-time.

We’ve also included OpenGL ES counters so you can see the number of triangles, texture uploads, scissors and many more stats as your application is submitting calls.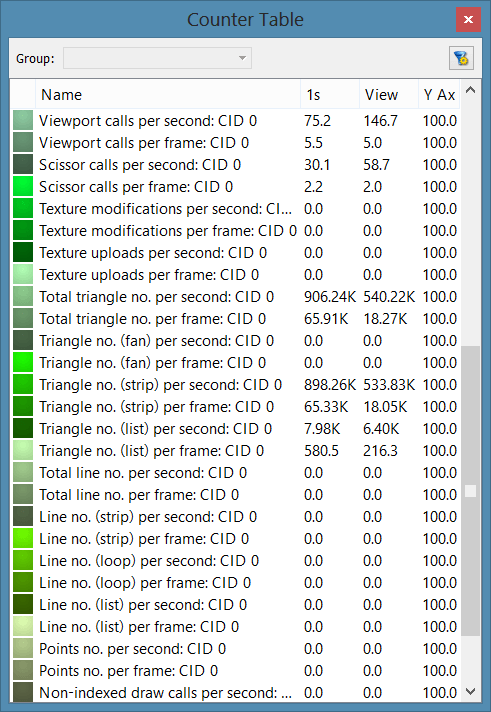
We’ve also exposed the API for timing data in our PVRScope library. This allows you to integrate the library into your applications and use PVRTune as a cross-platform CPU profiler!
On top of this, PVRTune has been given a new, powerful search engine that returns frame numbers, time periods, tasks (e.g. 3D, TA, SPM) and custom markers that match your search query.
More improvements for PVRVFrame and PVRTexTool
PVRVFrame has been updated with better error reporting, and is now offering an in-depth explanation of the conditions that caused an error. Additionally, the Device Profile inspector makes the capabilities of the emulator’s hardware profiles visible to the user.
Finally, PVRTexTool has added a new PVRTC compression mode for high-speed, development-quality texture compression.
Help us make the PowerVR Graphics SDK even better
Contact us via our email support or the Imagination Developer Forum where you can submit feature requests and bug reports and comment on other developers’ ideas.
To find out more about the PowerVR ecosystem, please join us for our first Imagination Developers Connection events. The next one will be taking place in Seoul, Korea and features presentations and interactive sessions with PowerVR graphics experts. If you are in the area and want to attend, make sure your register now, availability is limited.
Follow us on Twitter (@ImaginationTech) and keep coming back to our blog as we continue to bring you the latest news and announcements on PowerVR.